

Scalar360 Analytics & reports

Reports that stay tied to the recordsKnow what changed. See why.

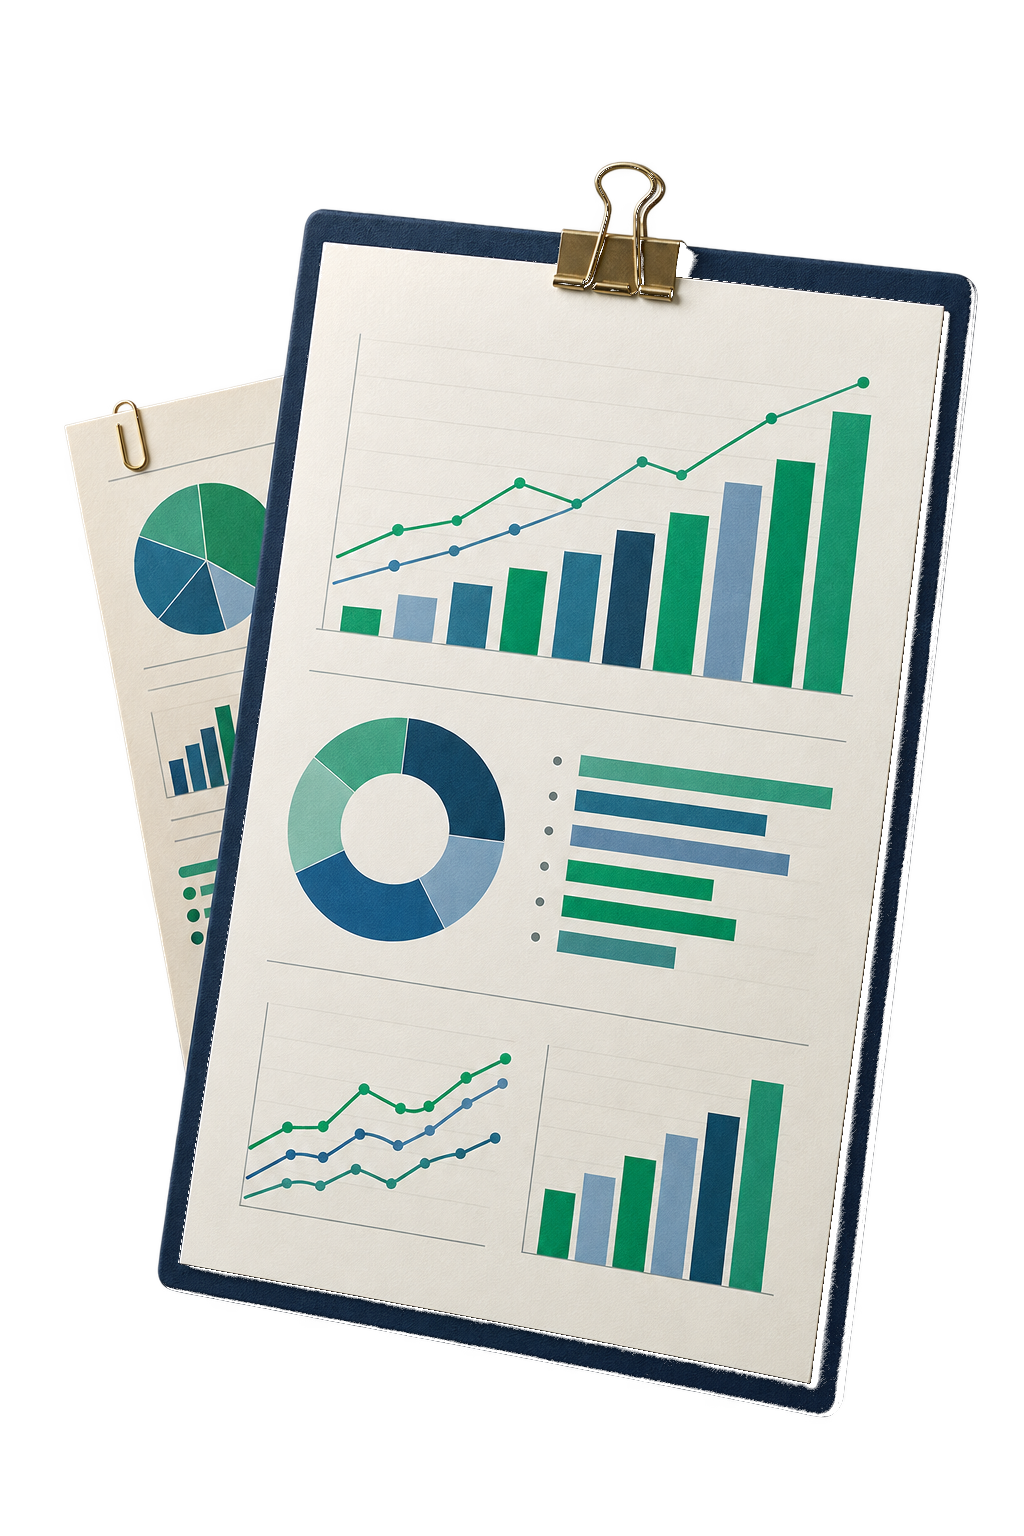
Read sales, purchasing, inventory, cash, accounts and GST from one reporting workspace—with the detail behind every headline close by.

Revenue vs spendInvoice ageingStock ledgerPayablesDay bookGSTR-1GSTR-3BSaved viewsPDF · Excel · CSV

A number becomes useful when its records are still attached.

A revenue total can signal a change. The invoice, customer, item and collection trail explain what the business should do next.

Scalar360 keeps the summary and the operating detail in the same flow, so reviews move from observation to action without rebuilding a spreadsheet.

Report library

Twelve operational reports. Four ways into the detail.

Choose a collection to see the questions each report is ready to answer.

Follow revenue from the invoice total to the customer, item and unpaid balance behind it.

₹ 28.4LInvoiced this period

Sales summary

Invoiced, collected, outstanding and average invoice value.

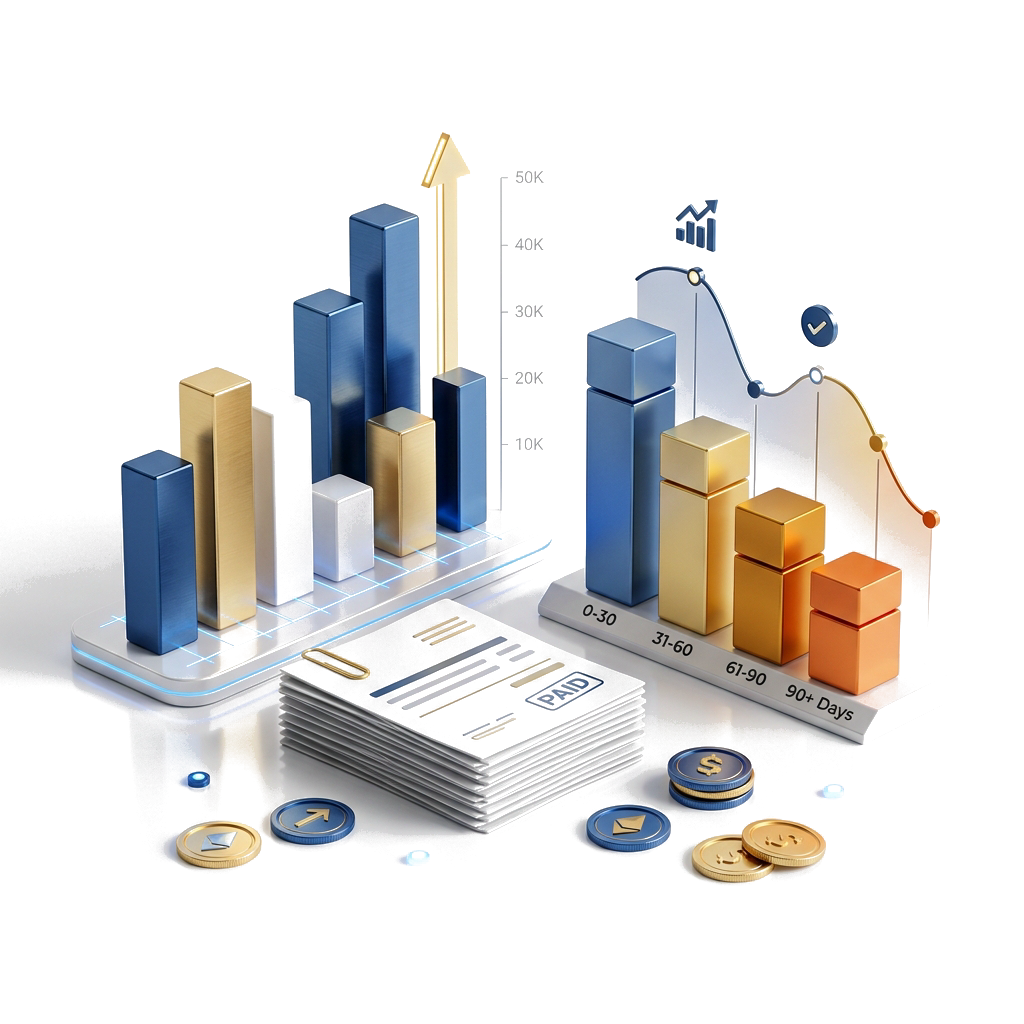
Invoice ageing

Overdue invoices organised by age and customer.

Top customers

Highest billed customers with outstanding balances.

Top items

Best-selling items by quantity and revenue.

Totals tell you where to look.

Details tell you what to do.

A clearer review rhythm

From business question to shareable answer.

One reporting flow keeps the period, summary, underlying detail and final export aligned.

Frame the period

Start with the window that matches the decision.

Use today, week, month, quarter or exact dates so the summary and every underlying row answer the same question.

Read the signal

See the headline and its operating context together.

Compare revenue, spend, margin and stock health before moving into the report that explains the change.

Follow the detail

Move from total to customer, item or transaction.

Ageing rows, item movements, ledgers and tax lines keep the evidence close to the number being discussed.

Carry it forward

Save the view or export the complete result.

Return to the same report period later, or take the full dataset into a PDF, Excel workbook or CSV file.

Complete capability directory

The reporting work, grouped around the decisions it supports.

Business pulse

Open with a connected view of commercial, operational and financial performance.

  • See invoiced revenue, billed spend, net profit, profit margin and stock value in one overview.
  • Compare revenue and spend across the latest six months.
  • Review collection, vendor payment, stock health, profit margin and CRM conversion together.
  • Move into sales, purchase, inventory, CRM and accounting dashboards from the same reporting area.
  • Surface active leads, outstanding receivables, cash and bank position, top debtors and top items in the wider business dashboard.
  • Keep dashboard access and report actions permission-aware by role.

Sales & collections

Understand what was billed, what was collected and where revenue is still waiting.

  • Review invoice count, total sales, collected amount, outstanding amount and average invoice value for a period.
  • Group overdue invoices by age while retaining invoice number, customer, due date, age and amount.
  • Rank customers by billed value and keep each customer’s open balance visible.
  • Rank items by quantity sold and net revenue.
  • Use the sales dashboard for invoice, draft, paid, unpaid, overdue, customer and quotation counts.
  • Track total invoiced, collected, outstanding and current-month sales with a period trend.
  • Search and sort detailed report rows without losing the summary for the complete period.

Inventory & movement

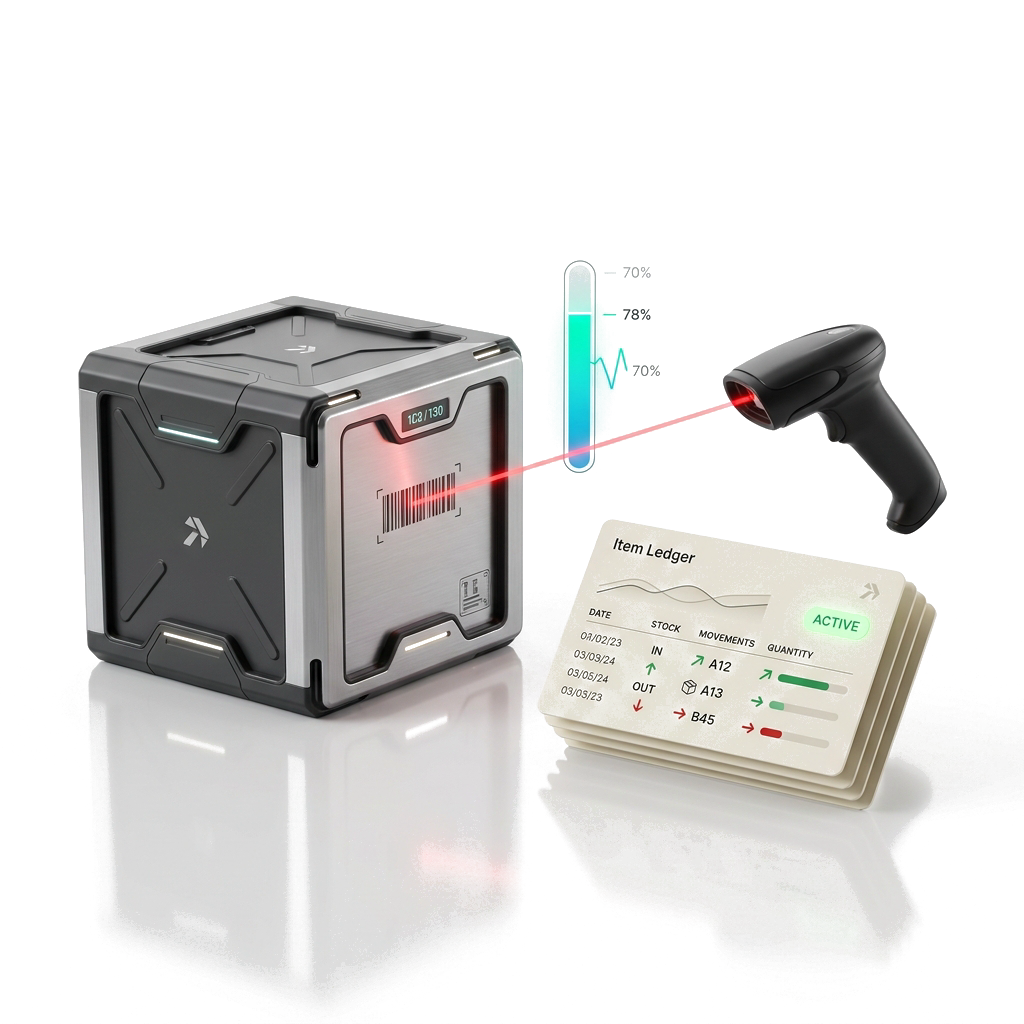
Connect the current stock position to every receipt, issue, adjustment and cost behind it.

  • Review on-hand quantity, stock value at cost, item count and total inventory value.
  • Select an item and date range to open its movement ledger.
  • Carry opening quantity and value through purchases, sales, adjustments and the closing position.
  • Follow a running quantity balance for every stock movement.
  • Review gross profit and lot-level profit or loss using the current cost basis and sales net of tax.
  • See adjustments and shrinkage separately from normal inward and outward movement.
  • Identify items below reorder level with on-hand, reorder point and shortfall.
  • Use inventory dashboard totals for tracked, low-stock and out-of-stock items, warehouses, categories and retail value.

Purchases & payables

Keep purchasing volume and supplier obligations visible before they become surprises.

  • Review supplier payable balances with vendor identity, GSTIN and credit terms.
  • Use vendor, purchase order, bill, debit note, paid, unpaid and overdue counts in the purchase dashboard.
  • Compare total billed, total paid, total payable and current-month purchasing.
  • Read purchase trends for the selected reporting period.
  • Use creditors ledgers and payable ageing to follow a supplier balance back to its entries.
  • Keep purchasing and cash-position reviews connected through accounting reports.

Accounts & GST

Read the books at statement level and retain the transaction path underneath.

  • Review profit & loss, balance sheet and trial balance statements built from recorded accounting entries.
  • Open the general ledger and journal to inspect the entries behind statement balances.
  • Use the day book to review transactions in chronological order.
  • Read cash and bank movements with date, narration, debit and credit values.
  • Review receivables, payables, debtors and creditors through their dedicated summaries and ledgers.
  • Inspect GSTR-1 outward-supply invoices with taxable value, CGST, SGST, IGST and invoice total.
  • Review a GSTR-3B snapshot of outward taxable value and component-wise tax liability.

Views & exports

Shape a report for the question at hand, save it and take the complete result into review.

  • Switch between today, week, month, quarter and a custom from-and-to date range.
  • Save a named report view together with its report type and selected period.
  • Return to saved views from the reports workspace.
  • Export supported reports as PDF, Excel or CSV.
  • Generate exports from the complete result set rather than only the page currently visible.
  • Browse long tables in manageable pages while keeping full-period summary totals.
  • Search and sort supported report details to reach the record that needs attention.
  • Limit saving and export actions to users with the corresponding report permissions.

Questions, answered

Before you open the numbers.

Which reports are included?

The report library covers sales summary, invoice ageing, top customers, top items, stock, stock ledger, low stock, payables, cash and bank, day book, GSTR-1 and GSTR-3B. Accounting also provides general ledger, journal, trial balance, profit & loss and balance sheet views.

Can we choose a custom reporting period?

Yes. Reports support today, week, month and quarter presets as well as an exact from-and-to date range.

Can a useful report setup be saved?

Yes. Name the view and save its report type and selected period, including custom dates, for quick return from Saved Reports.

Which export formats are supported?

Supported reports can be exported as PDF, Excel or CSV. Stock ledger also provides a CSV export.

Does an export contain only the visible table page?

No. The export is generated from the complete report result for the selected period, while the on-screen table is paginated for easier browsing.

Are reports predictive?

No. The dashboards and reports explain recorded business activity. They do not add speculative forecasts or AI-generated predictions.

Let’s connect
your business.

Bring your workflows. We’ll show you how they fit together in Scalar360.

Book a demosales@scalar360.com